
A list of tasks does not show when things happen or how they overlap. The Perfex CRM Gantt chart draws every task as a bar on a calendar, so you see the order, the length and the gaps at a glance. This guide, tested on Perfex CRM 3.4.1, shows where the chart is, how to read it and how to zoom.
What the Perfex CRM Gantt chart shows #
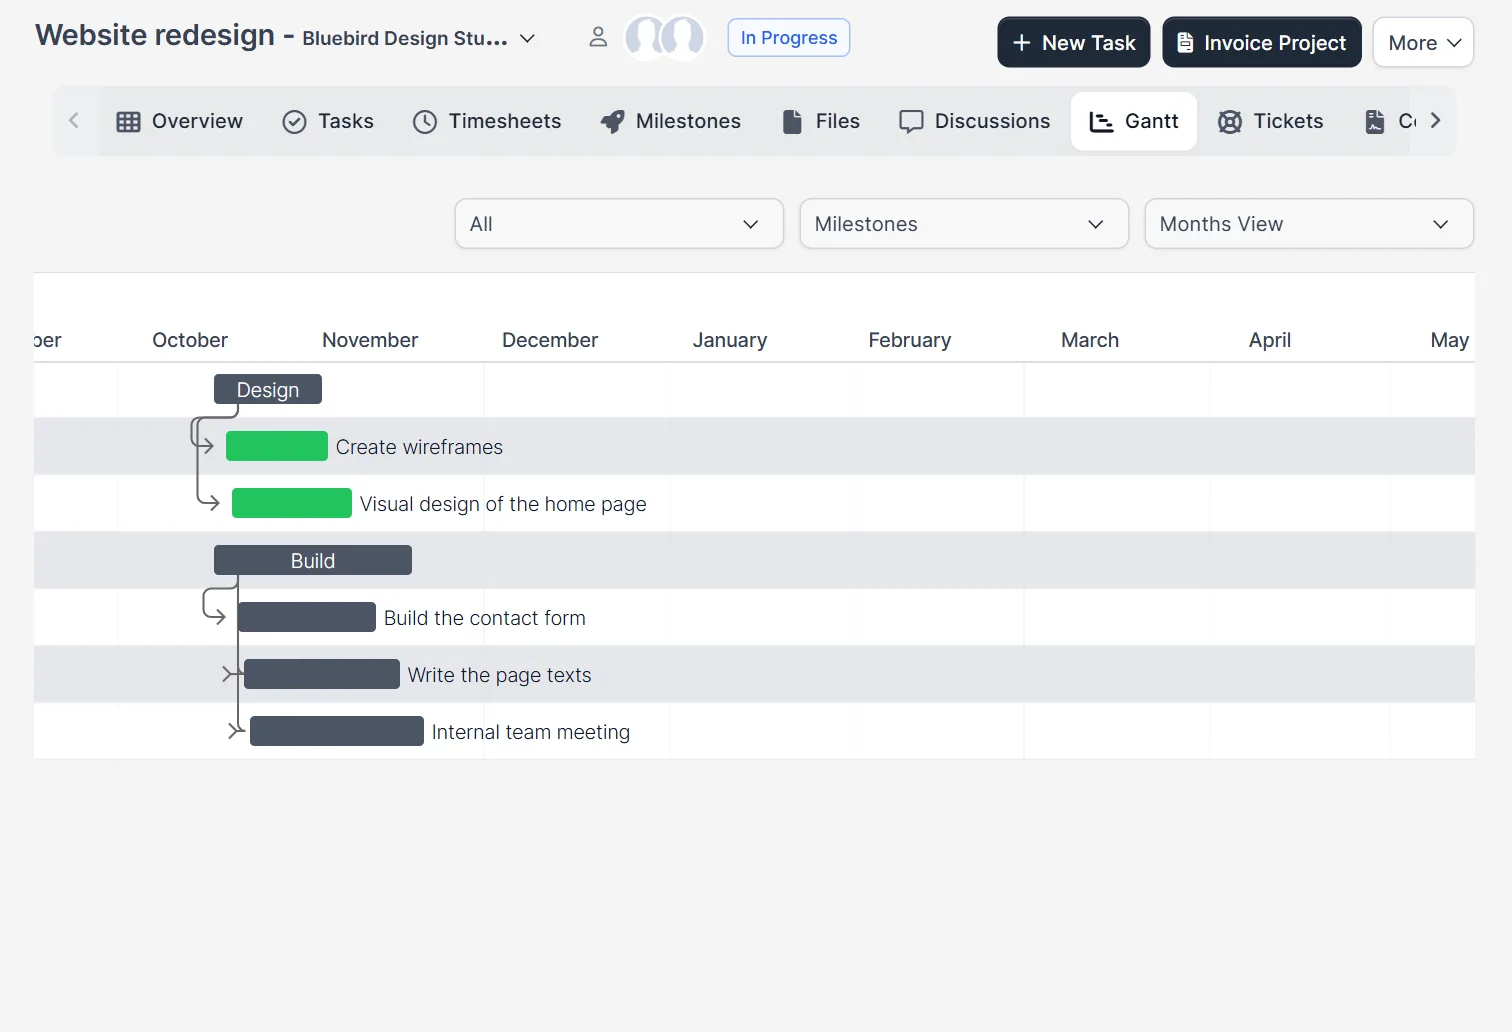
Open a project and click the tab Gantt. The chart has a time scale on top and one row for each milestone and each task. A milestone is a dark bar with its name, for example Design and Build. The tasks of a milestone sit under it. A task bar starts at the start date and ends at the due date of the task. Finished tasks are green, and open tasks are dark. This view is the project timeline of your work.
Step 1: Prepare the data #
The chart is only as good as the dates. Every task needs a start date and a due date, and every task should belong to a milestone. A task without dates has no bar. Create milestones first, as Perfex CRM project milestones explains, and give each task a milestone when you create it. See Perfex CRM tasks for the task fields.
Step 2: Read the rows and the arrows #
In our project, the milestone Design held the tasks “Create wireframes” and “Visual design of the home page”, both green because they were finished. The milestone Build held three open tasks. Thin lines with arrows connect a milestone to its tasks. The task bars of Design start earlier than those of Build, which shows the plan at once: first design, then build.
Step 3: Change the zoom #
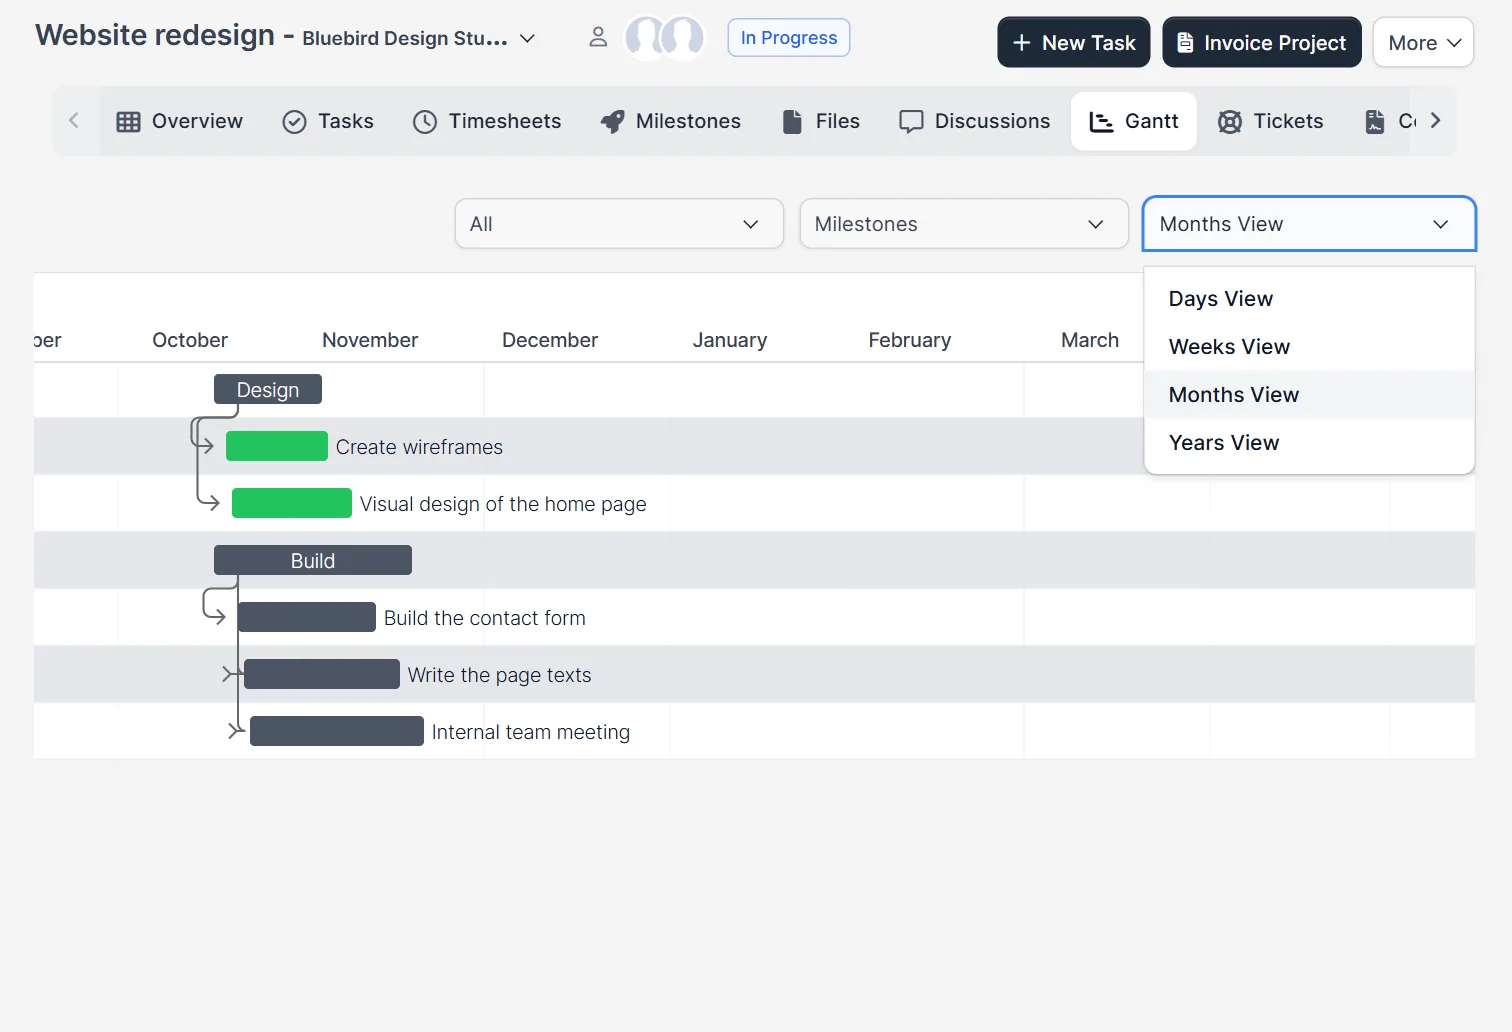
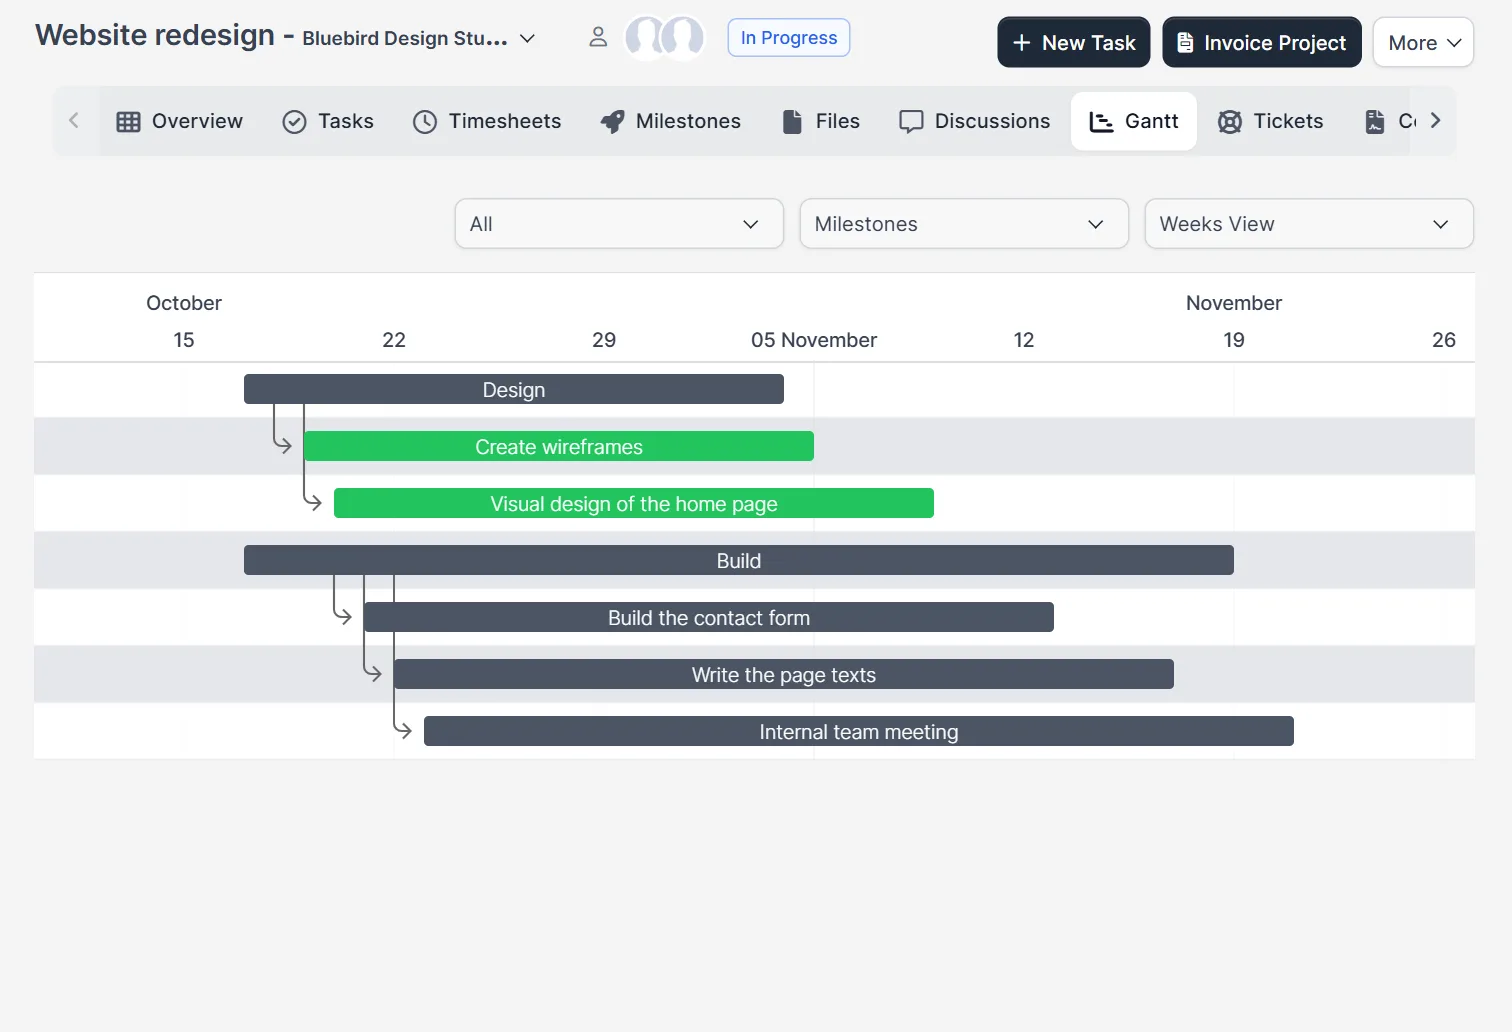
At the top right, a list offers four views: Days View, Weeks View, Months View and Years View. The chart opened in Months View. In Weeks View, the same bars are longer and the dates of each week show on top, which helps for a plan of a few weeks.
Step 4: Use the days view for the close look #
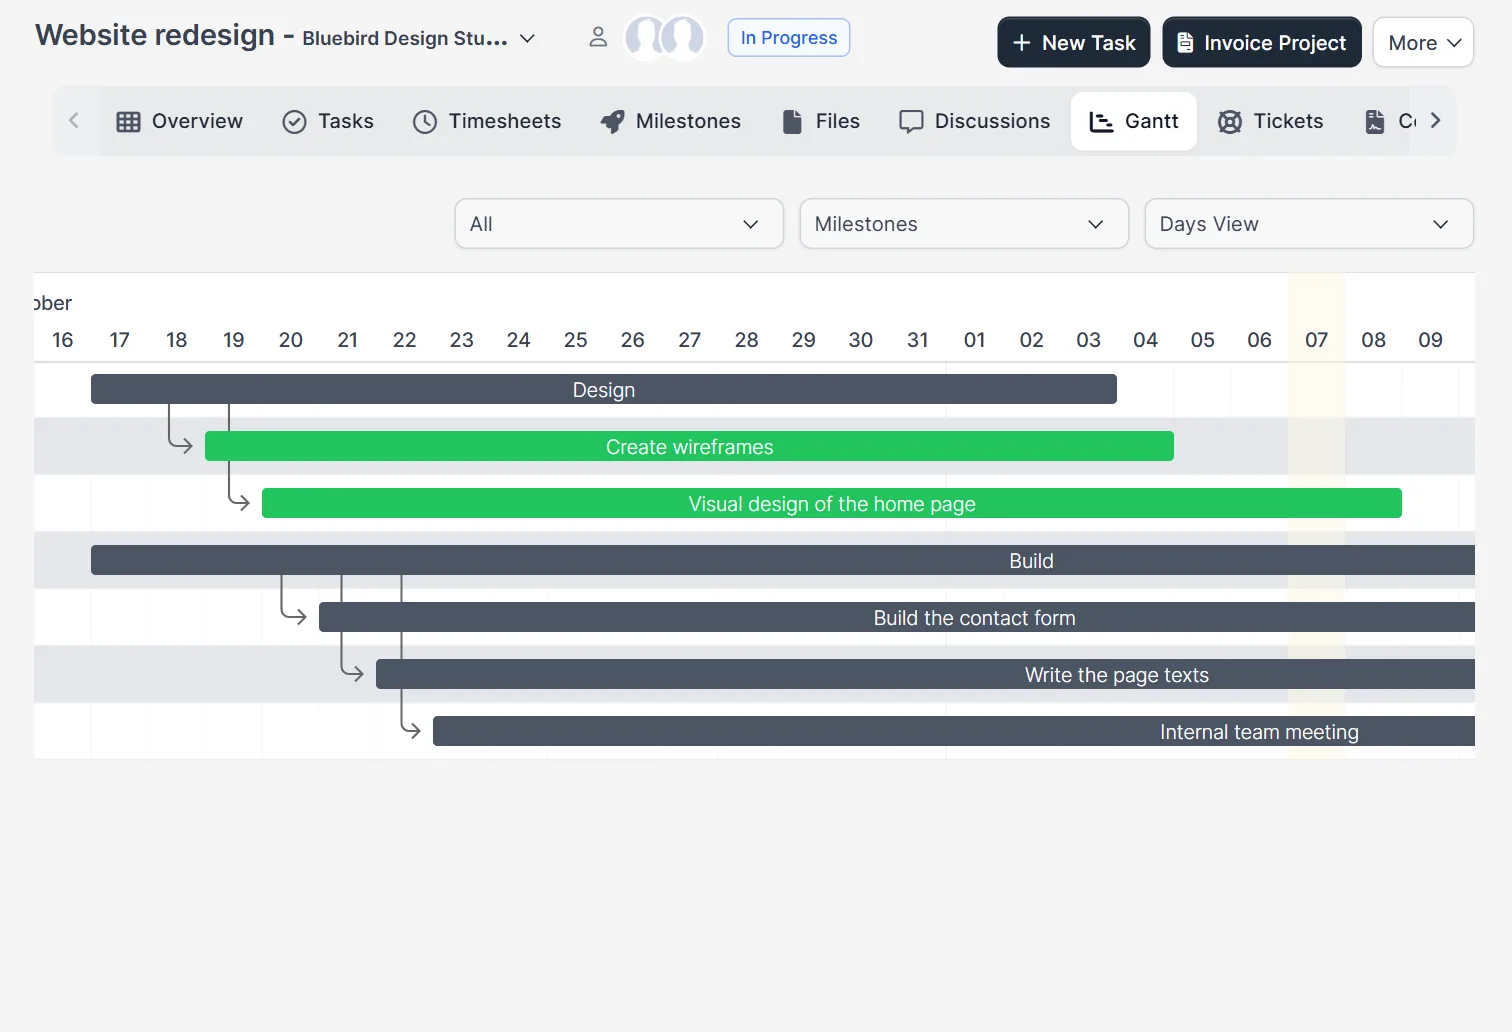
Choose Days View for a project of a few days or to check one busy week. Each day gets its own column. A long project in this view is wide, so scroll sideways. Use Years View for a plan that lasts many months and Months View for a normal project. A good habit with the Perfex CRM Gantt chart is to start in months, find the crowded area and zoom into it.
Step 5: Open a task from its bar #
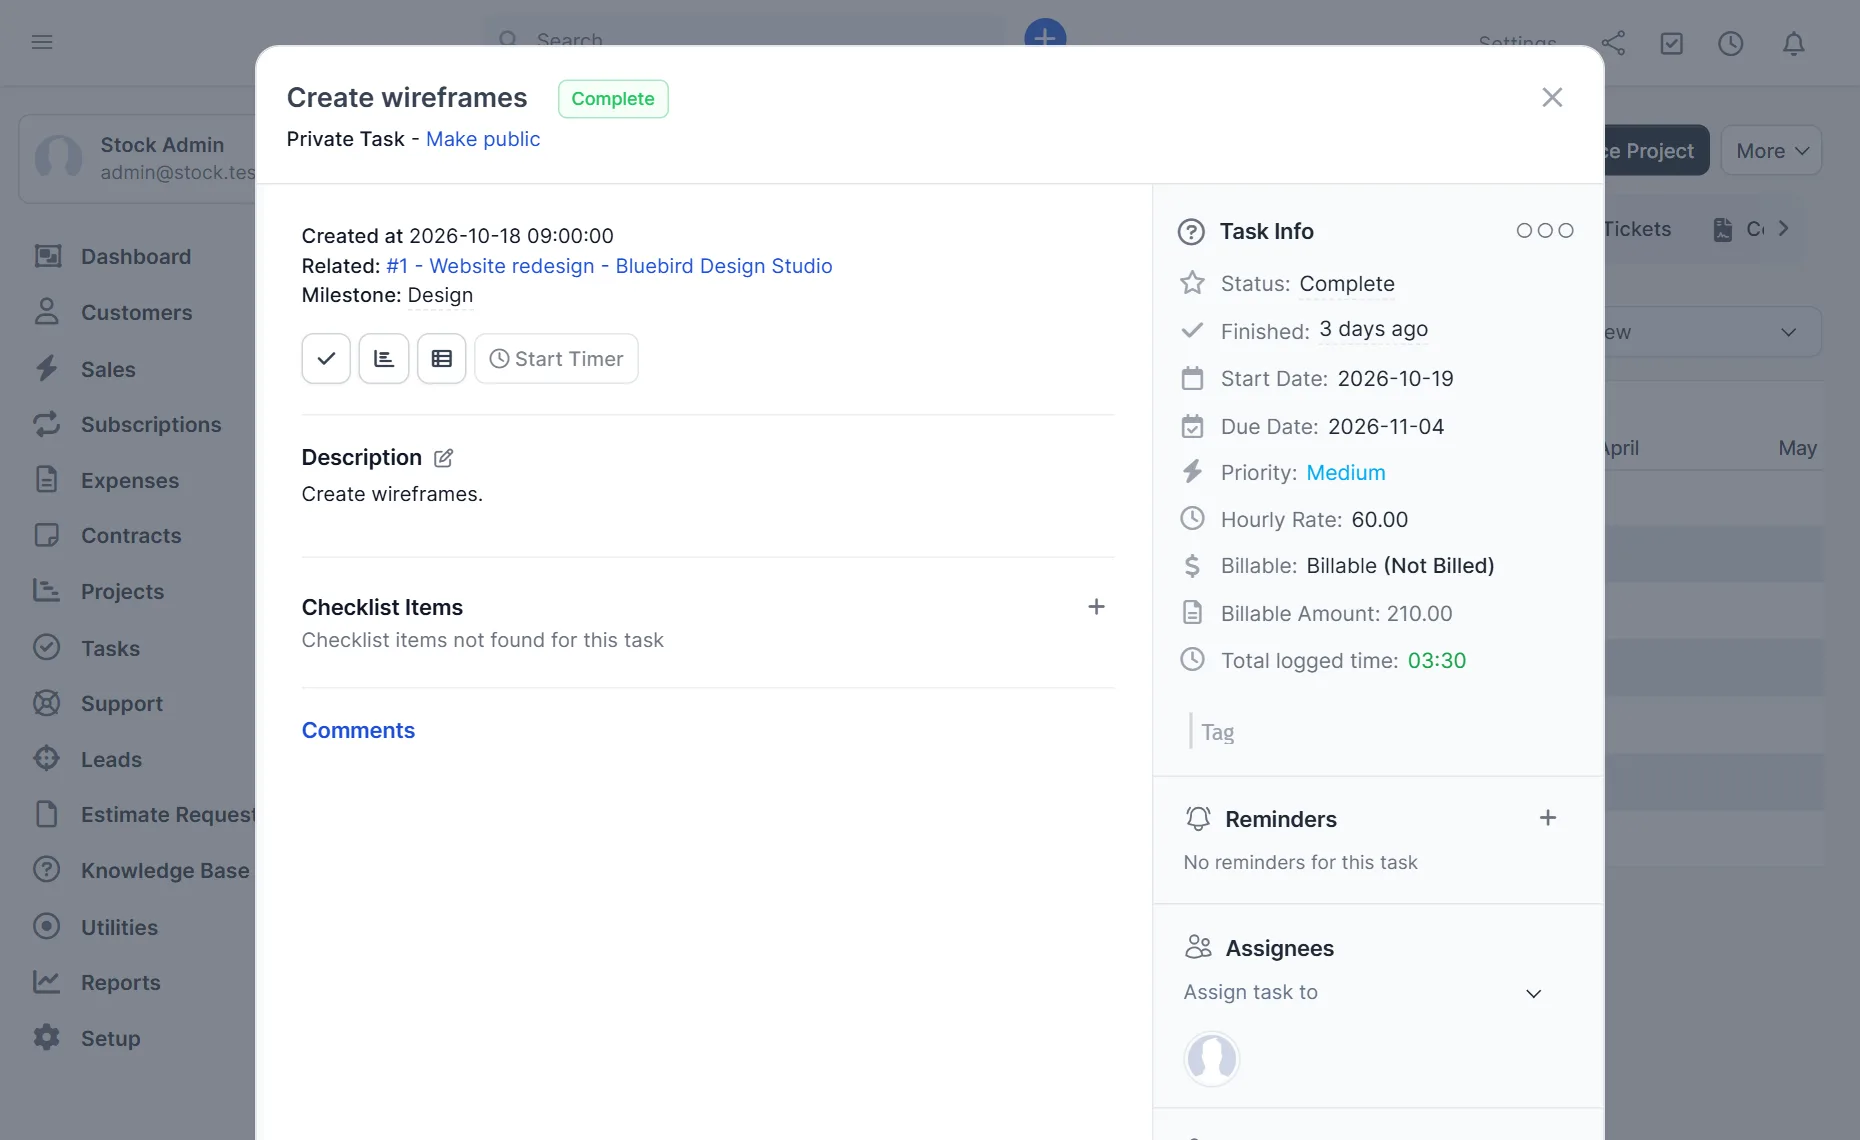
Click a task bar. The task window opens over the chart with the status, dates, priority, hourly rate, billable state and total logged time, and the tabs and buttons you know from the task list. In our test, the task “Create wireframes” showed Complete with its dates and 03:30 hours logged. Close the window to go back to the chart. Change the dates of a task in the window, and the bar moves.
Filters above the chart #
Three lists sit above the chart. The first one, set to All, and the second one, Milestones, narrow the rows. The third is the view. We left the first two on their defaults. Use the filters on a big project, so the Perfex CRM Gantt chart shows only the part you discuss in a meeting.
Tips for planning #
- Check the chart at the start of every week and look for tasks that ended but are still open.
- Keep milestones few and meaningful: three to six per project is enough.
- Give every task an owner, because a bar without an owner is nobody’s job.
- Use the Gantt chart together with the overview of Perfex CRM projects for numbers and progress.
- See Perfex CRM project statuses to mark a project finished when the last bar is done.
Why use the Perfex CRM Gantt chart #
The Perfex CRM Gantt chart turns a long task list into a picture that you can show in a meeting. A customer understands the Perfex CRM Gantt chart faster than a table, because the order of work is visible. Review the Perfex CRM Gantt chart weekly, and it becomes the quickest check of whether a project is on time.
Not tested here: the filter lists, changing a bar by dragging it, and what customers see of the chart. Read the official Perfex CRM help for more.
Related module: If you also need to track hours and leave for a team, the Timesheets and Leave Management for Perfex CRM module adds employee attendance, project hours and leave requests.
Frequently asked questions #
Where is the Perfex CRM Gantt chart? #
Open a project and click the Gantt tab.
Why does a task have no bar? #
It has no start date or no due date. Add both dates and the bar appears.
How do I zoom the chart? #
Use the view list at the top right: Days View, Weeks View, Months View or Years View.
Can I open a task from the chart? #
Yes. Click its bar and the task window opens.


